
Strategies For Fine-Tuning Your GTM Motions
Read time: 5 minutesWritten by:
-

Mallory Lee
SVP of Revenue Operations Strategy
Exec Summary
- Check out the full webinar replay
- The revenue factory is a strategic model
- It shows practical applications to GTM
- Understand the level of visibility you need
- Learn how to find the root issues
- Unblend your funnel (Simpson’s Paradox)
- How this can help your business TODAY
The concept of a revenue factory has been gaining traction, but what does it mean for your organization in a practical sense?
Last month I had the pleasure of hosting a webinar with Toni Holhbein, CEO of Growblocks, where we answered that question.
We talked about:
- Metrics to assess revenue efficiency
- The Simpsons Paradox (in your funnel)
- Strategic consideration for the end product
- Evolving through the stages of a GTM factory
- Practical applications of improving visibility
- Walking the factory floor (Nylas case study)
Click here to check out the replay!
More of a reader/skimmer? In today’s newsletter, I’ll be summarizing some of the key points we covered in the webinar. Let’s get started!
Going Deeper with the Revenue Factory Analogy
The core idea behind the Revenue Factory model is to visualize your go-to-market process as a factory floor. Imagine walking into an actual factory with assembly lines, robot arms, and materials flowing through various stages of production.
Similarly, in your GTM strategy, different inputs (leads, prospects) go through numerous processes before becoming valuable outputs (customers, revenue).
Each step of the journey from input to output is made up of interconnected machines. If one machine is broken or unoptimized, it can create a domino effect throughout the factory that leads to the symptoms we’re familiar with:
- High churn
- Low win rates
- Not enough pipeline
- Etc.
 Without visibility into the entire factory floor, we’re unable to trace the issues upstream to their root cause.
Another layer down, we see that each machine is also made up of interconnected parts. Sometimes, it’s just one part that’s malfunctioning, causing a domino effect throughout your factory.
For example, if there’s an issue with your ICP definitions, you’ll see the effects everywhere from marketing, to sales, to CS. ICP is a very upstream issue that can impact the velocity of the entire assembly line.
Dangers of a Blended Funnel
Simpson’s Paradox is a statistical phenomenon that occurs when trends that appear in different groups disappear or reverse when these groups are combined.
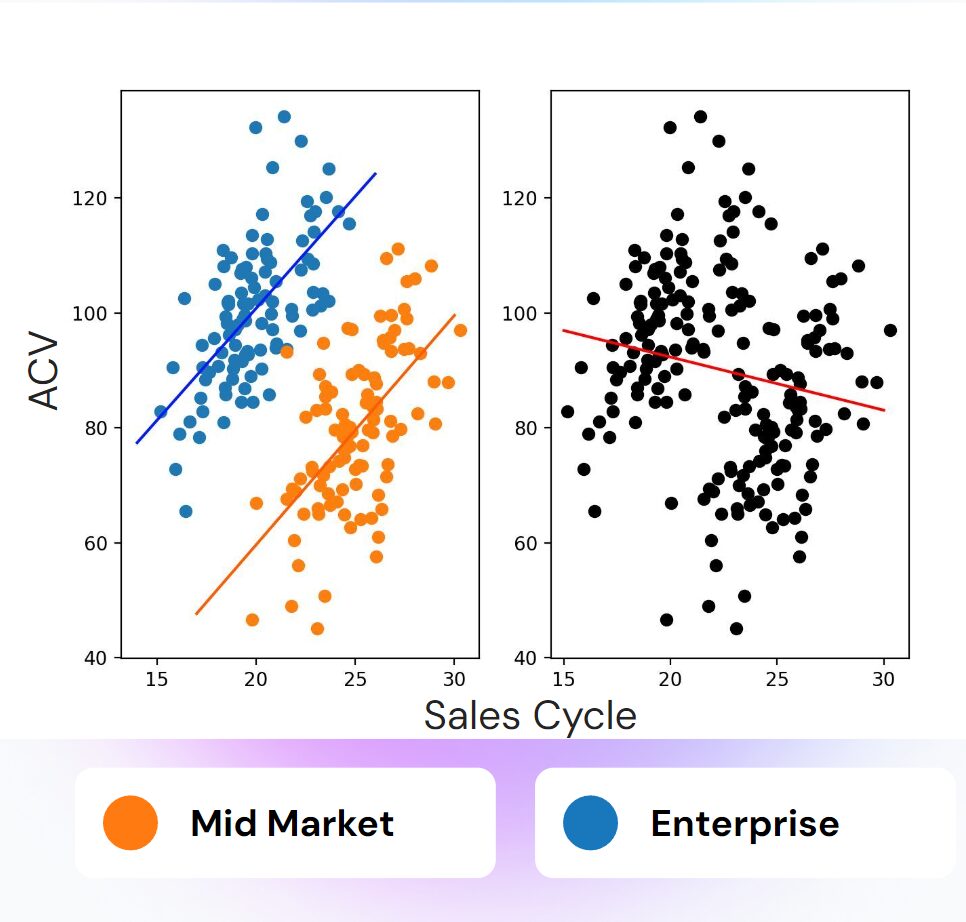
To apply a GTM spin, let’s look at the example in the chart. Analyzing your funnel velocity that’s segmented into mid market vs. enterprise may reveal completely different trends than when looking at the overall average. Remember, the details often tell the true story. And you need the true story to make strategic decisions. As you segment your data, you might actually catch completely different trends that require different strategic decisions. You can think of these segmented funnels as different “factory lanes” within your revenue factory.
Applying the Revenue Factory Model Today
If you’re unsure how to get started using this model in your business, creating a diagram that outlines your tech stack and data flow (aka, the Revenue process) like the ones I’m about to show you is likely where you should start.
If you can’t see what’s happening in your business, you have no way of finding the breakpoints (let alone making a plan to fix them).
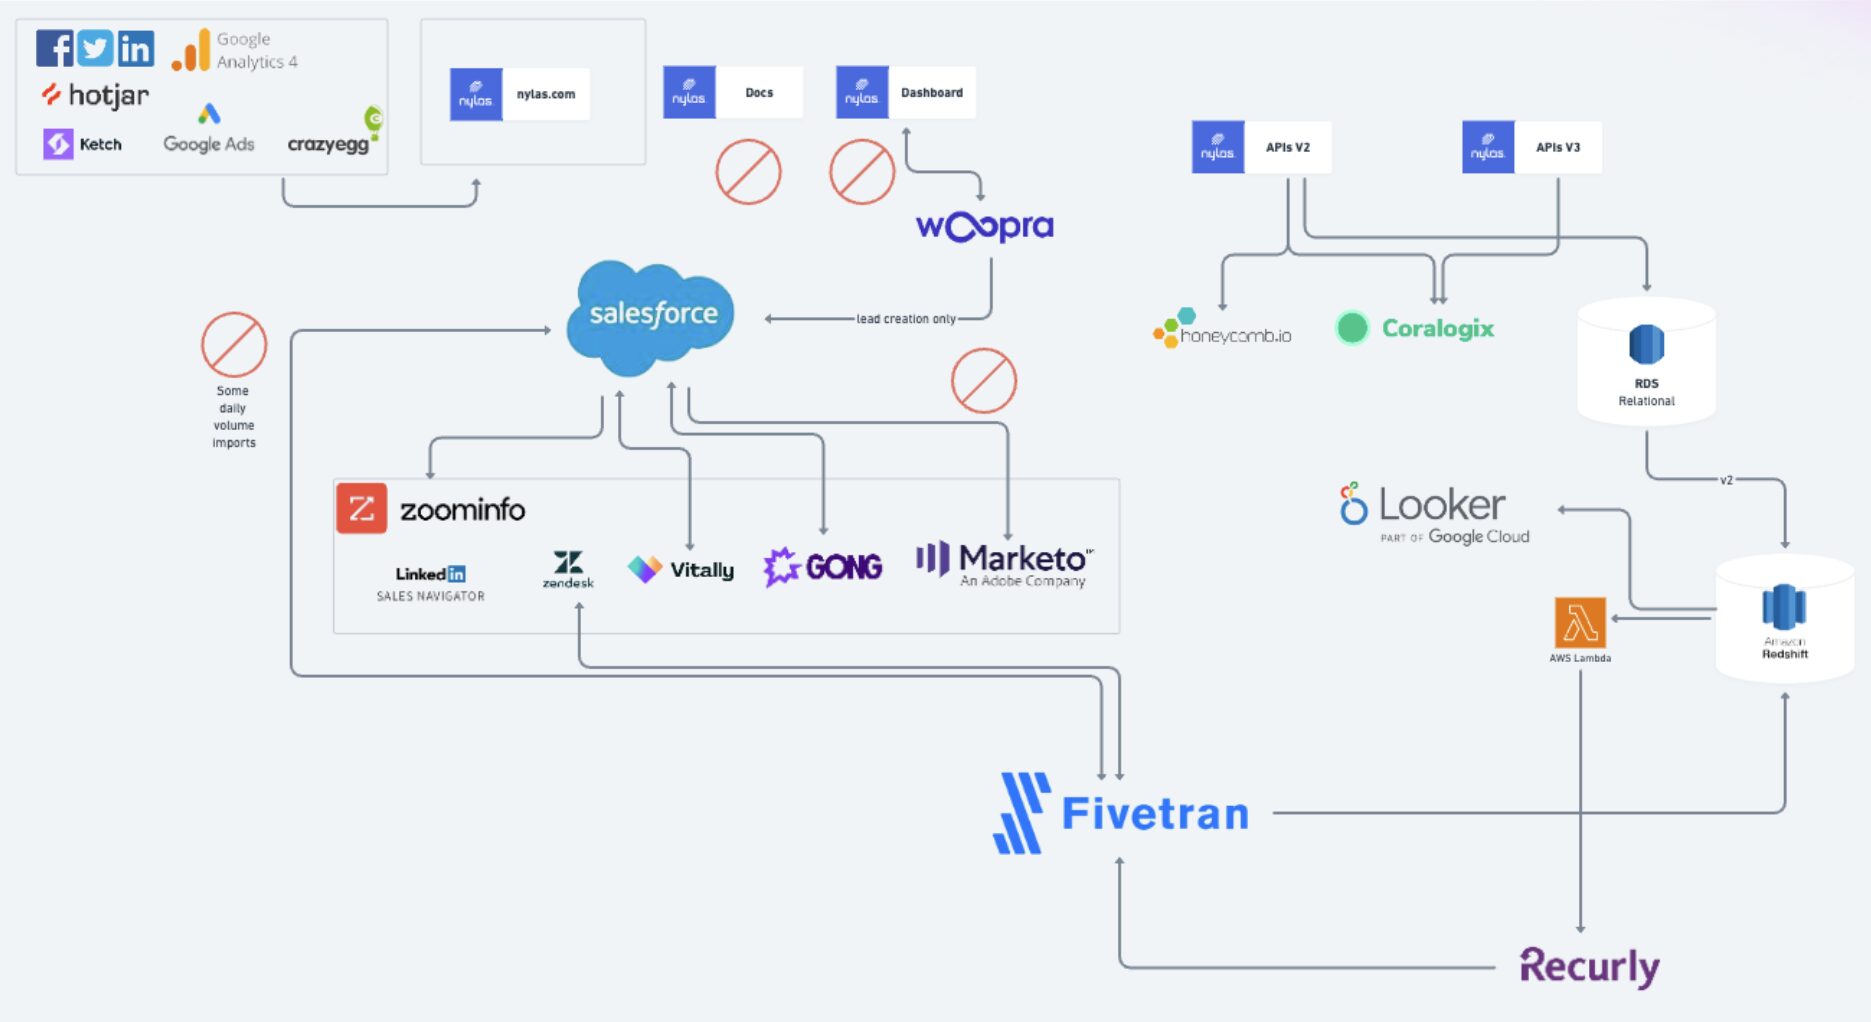
I’d love to share a quick before and after of Nylas and their factory floor. I was lucky to participate in a complete overhaul of this tech stack and data flow. What we ended up with was a much better customer experience and way more insights.
The team was able to use these insights to do testing on the product quick start guides and greatly increase the free-to-paid conversion rate. They had the information they needed to remove blockers and get users through setup much faster – even as fast as 1 day!
Before: Many disjointed tools and no insight into product usage
After: A new tech stack with connected flows and product events flowing to various systems.
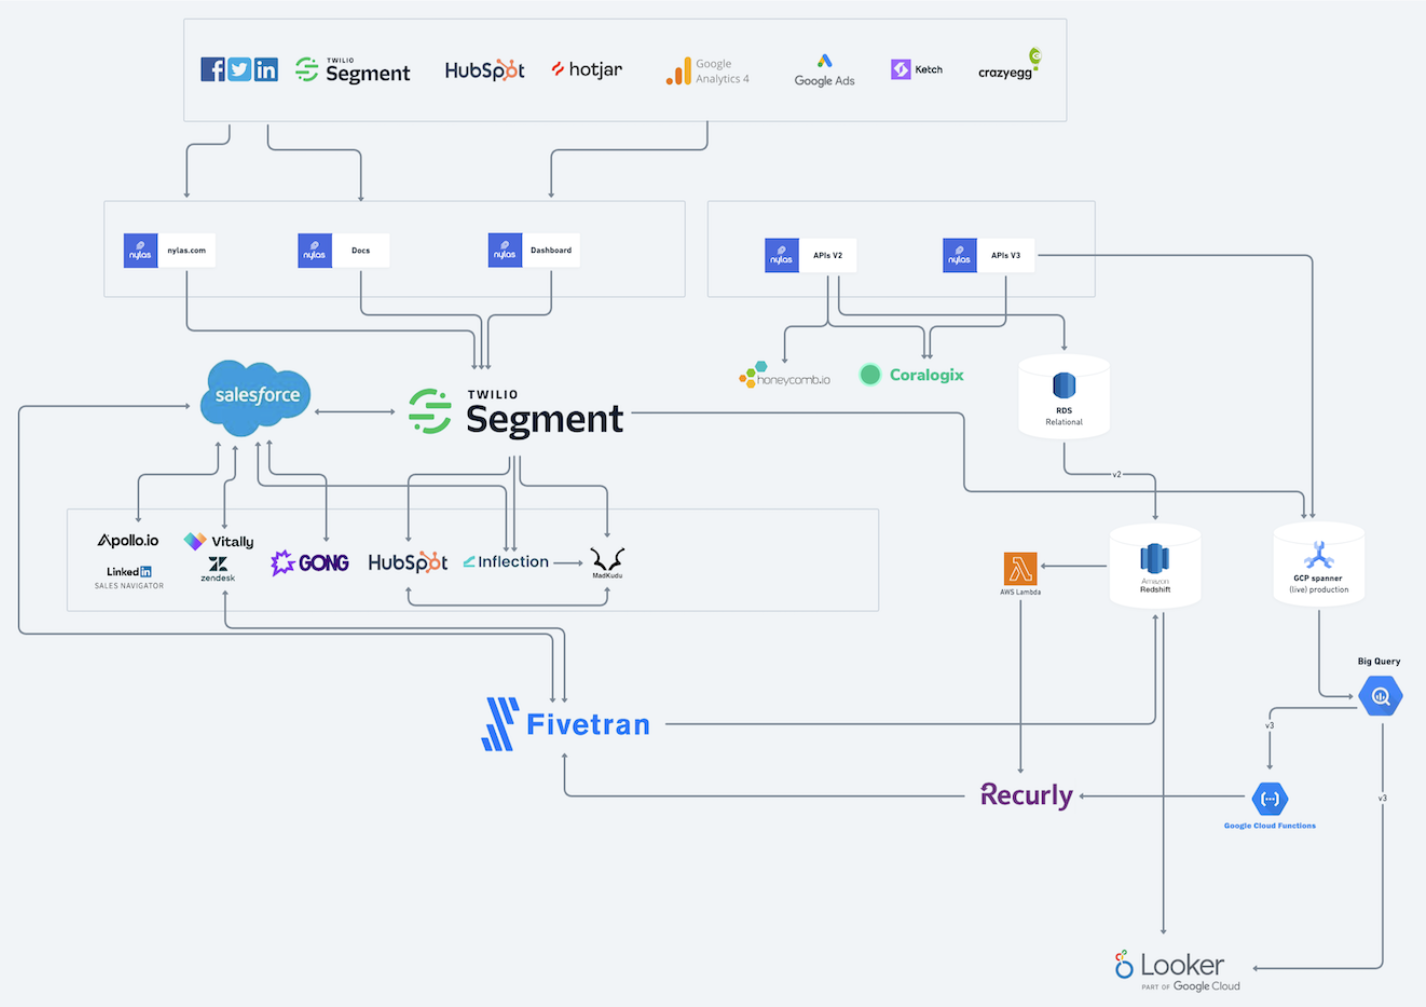
By the way, this took a full year to accomplish. It’s not quick and easy.
But if you want it to go faster and be easier on your team, consider partnering with specialists like us who do this every day.
Watch the webinar replay here, where we go even more in depth on this topic (one newsletter couldn’t possibly fit it all!)
The Fast-Track to Outcomes
Prioritizing areas for improvement is most effective when we see the entire landscape. This is the main goal behind “laying out the factory floor”. We will have a better understanding of how one improvement can also help down the line as it follows our revenue production lane.
The ability to identify where a deal is getting “stuck” is the key to unlocking velocity and better close rates.
By removing unnecessary steps, improving handoff from one team to another, or by automating certain steps in your process, you can:
- Speed up the sales cycle
- Improve sales velocity
- Increase revenue
When you’re ready, here’s how we can help:
Get a Free 1:1 Revenue Efficiency Workshop
Get one of our Senior Revenue Strategists to yourself for 1 hour and leave with a plan to increase the money-making power of your go-to-market operations.
Hire Us!
Bring us on as your Strategic RevOps Team and realize the growth potential of your revenue engine. There are 3 ways to work with us.
Get more tips like these, sent right to your inbox.
Subscribe for fresh, relevant revenue growth tips delivered every week.