
The GTM Ops Diagnostic Framework
Read time: 18 minutesWritten by:
-

Eddie Reynolds
Founder & CEO

Download Infographic: Click here to download high-res PDF
Every revenue leader we work with is facing the same daunting task: hit the number this quarter while building a GTM Engine that actually scales. Hitting the number is hard enough on its own. Finding time and resources to actually fix GTM? Nearly impossible.
This is why ruthless prioritization is critical. When CROs hire us, they expect tangible impact in the first 90 days, so we face the same pressure.
In this Framework, we’ll share a comprehensive model for diagnosing the weak points in your GTM operations and figuring out what to fix first. Think of this as an actionable preview of our +150-point diagnostic, adapted for your use.
Fair warning: Just like our internal diagnostic, this Framework requires more than checking boxes. We could’ve made it easier, but we’d rather make it useful.
How to Get the Most Out of This Framework
We’re going to look at the GTM Engine through multiple lenses.
First, we’re going to look at the maturity of our GTM motions through four distinct stages: Fundamentals, Adoption, Optimization, and Amplification. We can then look at any part of the customer journey through those four stages.
We’ve then broken this down into seven areas of GTM across three phases: Pipeline Generation (Outbound, Inbound, ABM/Allbound, Partners/Channel), Pipeline Management, and Customer Success (Renewals and Expansion).
We’ve also created the GTM Ops Decision Tree to help prioritize where exactly to focus. Without this focus, it’s easy to get lost in the hundreds of potential GTM Ops projects we could spend our resources on. Instead, we’re diagnosing for the highest impact on revenue possible.
Once we’ve narrowed focus, we can go through the most relevant diagnostic questions, outline a heatmap, and translate it into a GTM Ops Roadmap. Finally we’ll share how to execute that roadmap and drive impact quickly.
If you need help executing on your results, let’s talk! That’s what we’re here for.
Let’s get into it!
Past the diagnosis?
Let’s get it moving.Book a free GTM Ops Execution Workshop.
Bring your top priority and walk away with a validated approach, a phase-by-phase roadmap, and an execution timeline.
Step 1: Understand the Four Stages of Maturity
Each part of our GTM process moves through the same four maturity stages. We visualize this in the GTM Efficiency Pyramid.
The four stages are Fundamentals, Adoption, Optimization, and Amplification. Each builds on the one before it.
It’s important not to skip stages because:
- We can’t consistently execute on processes that don’t exist
- We can’t optimize what isn’t being executed properly
- We can’t (or shouldn’t) amplify what isn’t optimized
But here’s what we see all the time: companies jumping straight to Amplification (buying the AI tool, implementing the automation) while their Fundamentals and/or Adoption are completely broken.
Automating a broken process doesn’t work. It never works. And it’s expensive.
So let’s walk through what each stage actually means, and why the order matters. Click here if you want to learn more in depth about the GTM Efficiency Pyramid.

Fundamentals
The fundamentals are the basic definitions and process our team needs to follow to execute our GTM motions. It varies for each motion, but at a high level, here’s a summary.
- ICP and Buyer Personas are well defined
- The step by step process is defined and documented
- The systems are configured to support execution of the process
When Fundamentals are missing, everyone on the team has a different understanding of the process and the systems aren’t configured correctly, making their jobs more difficult.
A classic example is a sales team where everyone has their own definition of a qualified opportunity, their own way to close deals, and, as a result, wildly different close rates and sales cycles, and no one trusts the pipeline report. Fixing this starts with clearly defining the process.
Adoption
The Adoption stage is where we get people executing the process consistently:
- We’ve trained the team
- We have clear reporting and accountability
- Management has a regular review process
- The team is executing the process consistently
This is where most companies get stuck. They have the Fundamentals in place, but CRM data is garbage (inconsistent, inaccurate, and unreliable) because team members aren’t updating it properly or following process. This is also the hardest part because it requires a commitment from management to stick to the process they agreed upon and hold the team accountable.
Optimization
Once the fundamentals are in place and the team is adopting the process consistently, we can start to leverage the data to find ways to optimize GTM:
- GTM Ops and Management regularly analyze GTM data
- GTM Ops uncovers and presents insights on GTM to leadership
- We have a regular meeting, such as a GTM Council, to discuss insights and take action
It’s not enough to have the data and the reports. If we don’t have our Fundamentals and Adoption in place, we won’t be able to trust that data and we’ll be stuck in meetings asking “Where did that number come from?”
Even with the right data, it’s still not enough. We need to dedicate time and resources to analyzing that data, uncovering real insights, get leadership together to discuss what to do about it, and then take action to optimize our GTM Engine.
Amplification
Finally, we get to Amplification, where many of the shiny objects lie. Assuming we’ve mastered the fundamentals and optimized them at least a little, we can look to automation, AI, and other things to get leverage on what’s working.
The list of things that fall into Amplification is a mile long and constantly evolving, but here are just a few:
- Predictive analytics for forecasting
- AI-powered deal scoring in pipeline
- Automated health scoring for CS teams
- Intent data driving outbound prioritization
Here’s why this is the top of the pyramid: Automating a broken process just creates problems faster. Feeding AI bad data gets bad predictions. We see companies blow their budget on Amplification tools when they should be investing in getting the foundation right first. There is no magic bullet. There’s just good process, consistent execution, smart optimization, and then, and only then, seeking greater leverage on those working motions.
Step 2: Identify our Focus Area
Our GTM Diagnostic is +150 questions. Ignoring the time it would take to answer every question, it would take far too long to try to fix all of GTM to make this worthwhile. Instead, we want to focus on the biggest constraint or opportunity in GTM that we can work on in the next 90 days or so.
To do this, we use the GTM Ops Decision Tree.
We start by asking a simple question. If we could improve ONLY one thing in the next 90 days, would we focus on New Business or Net Revenue Retention?
Whatever the answer, we then ask the same question drilling down another layer. Let’s say it’s New Business. If we could improve ONLY one thing in the next 90 days for New Business, would we focus on Pipeline Generation or Pipeline Management?
Then we go to another layer. Let’s say we want to focus on Pipeline Generation. If we could improve only one thing, would it be our Outbound, Inbound, ABM/Allbound, or Partners/Channel motion?
For many GTM teams we can make substantial improvements in 90 days in 1-2 areas of GTM, preferably related areas such as Outbound and Pipeline Management and then move on to other areas in the following 90 days.
You can read more about the GTM Ops Decision Tree here.

Step 3: Answer the Diagnostic Questions
Now we get into the actual diagnostic. Instead of sharing all +150 questions, we’ve simplified this into just 4 questions per area of GTM to make it easier. Each of the 4 questions correspond to the 4 maturity stages.
Answer each question using a traffic light scoring system:
- Green: Strong Yes – We can say yes to every part of the question, with no exceptions. We know that other revenue leaders would also say yes.
- Yellow: Somewhat – We can only say yes to some parts of the question and/or we’re unsure if other revenue leaders would be able to say yes.
- Red: No – The most realistic answer to the question would be no, even if we could say yes to one part of it.
The Diagnostic Questions
In each area of GTM we have 4 questions, the evidence you should be able to pull to support your answers, and red flags to note.
A) Pipeline Management
Fundamentals
- Do we have a documented sales process with clear qualification criteria, as well as clear stage entry/exit criteria, all implemented in our CRM?
Adoption
- Do our sales managers regularly coach reps on following the sales process and accurately inputting CRM data, resulting in pipeline data that is consistent, accurate, and reliable?
Optimization
- Do we analyze pipeline data (by segments) to identify and execute on process gaps, lead quality issues, and resource redistribution opportunities?
Amplification
- Are we using automation or AI tools to enhance pipeline visibility, coaching insights, and forecasting?
Evidence to pull: stage conversion table, forecast vs actual, field completeness by stage, stale opps, loss reasons distribution.
Red flags: forecast swings week to week, manager exceptions to process, sandbagging or pipeline inflation.
B) Inbound
Fundamentals
- Do we have a documented lead qualification criteria and routing process implemented in our systems, as well as a defined and documented ICP (that matches with sales and customer success data)?
Adoption
- Do we consistently meet lead-response times and follow-up cadences across all inbound channels, as well as consistent/accurate lead quality tracking data?
Optimization
- Do we track conversion from each source all the way to Closed Won/retained/expanded to guide inbound spend, targeting strategy, and refinements to our lead scoring and routing rules?
Amplification
- Are we using automation or AI to qualify/route leads, accelerate response times, and refine attribution?
Evidence to pull: SLA report, source→stage conversion, attribution trust score, cadence adoption.
Red flags: high lead volume with low SQO yield, manual routing, campaign taxonomies that change every quarter.
C) Outbound
Fundamentals
- Do we have defined and documented ICP (that matches with marketing and customer success data) and capacity-based territory assignments for our outbound reps?
Adoption
- Do our reps consistently execute outbound cadences and sales processes with tracked activity and conversion metrics?
Optimization
- Do we regularly analyze which accounts and personas (by segment) convert and retain best to optimize our targeting and messaging strategies?
Amplification
- Are we using automation or AI to scale our outbound prospecting efforts?
Evidence to pull: coverage report, cadence adoption, funnel metrics, SLA report.
Red flags: broad “spray” lists, uneven rep coverage, no meeting quality definition.
D) ABM/Allbound
Fundamentals
- Do we have a defined account scoring model to identify target accounts, a documented process to coordinate inbound and outbound efforts on those accounts, and capacity-based territory plans implemented in our systems?
Adoption
- Do our sales and marketing teams consistently execute coordinated account plays with tracked engagement across both inbound and outbound touches, and do we have reporting that ties activity to account-level progression?
Optimization
- Do we regularly analyze account engagement data to identify which account segments, plays, and channels drive the best conversion and retention, and use those insights to refine our targeting and scoring models?
Amplification
- Are we using automation or AI to orchestrate multi-channel account plays, trigger account-based actions based on intent or engagement signals, and optimize account scoring?
Evidence to pull: account scoring model documentation, account-level engagement and conversion reports, coordinated play execution data, account coverage report.
Red flags: sales and marketing running separate target lists with no coordination, account scoring that nobody trusts, no visibility into which accounts are being actively worked across teams.
E) Partners/Channel
Fundamentals
- Do we have a documented partner recruitment and onboarding process, clearly defined partner tiers or criteria, and a system to track partner-sourced and partner-influenced pipeline?
Adoption
- Do our partner managers consistently execute on the partner engagement process with tracked activities, and do partners have a clear path to register deals and collaborate with our sales team?
Optimization
- Do we regularly analyze partner performance data (by partner, segment, and deal type) to identify top-performing partners, optimize co-selling motions, and refine our partner program?
Amplification
- Are we using automation or AI to scale partner communications, surface co-selling opportunities, and streamline deal registration and attribution?
Evidence to pull: partner-sourced vs partner-influenced pipeline report, partner tier distribution, deal registration data, partner engagement and activity metrics.
Red flags: no formal deal registration process, inability to distinguish partner-sourced from partner-influenced revenue, partners disengaging after onboarding, channel conflict with direct sales.
F) Renewals
Fundamentals
- Do we have a documented process for customer onboarding (including handoff), health monitoring, and renewal management (with defined stages, metrics, and forecasting)?
Adoption
- Does our CS team consistently execute all process steps with tracked activities, customer health signals, and risk actions?
Optimization
- Do we analyze churn patterns, customer health data, and cohort-level retention metrics to identify at-risk segments and improve retention strategies?
Amplification
- Are we using automated health scoring with risk notifications and AI-driven playbooks to scale CS effectiveness and predict churn before it happens?
Evidence to pull: renewal forecast vs actual, health score coverage, churn cohort analysis, onboarding completion rates, risk action log.
Red flags: renewals run like fire drills, health scores that no one believes, no documented handoff process, churn surprises with no early warning.
G) Expansion
Fundamentals
- Do we have a documented expansion process that includes customer journey mapping, capacity and territory planning, account scoring and assignment, a defined account sequencing process, and product and stakeholder whitespace mapping?
Adoption
- Do our expansion reps (or CSMs who own expansion) consistently execute the expansion process with tracked activities, and do we have reporting that shows expansion pipeline by account segment, product, and stage?
Optimization
- Do we regularly analyze expansion data to identify which customer segments, products, and engagement patterns drive the best expansion outcomes, and use those insights to refine our targeting and sequencing?
Amplification
- Are we using automation or AI to identify expansion signals, trigger expansion plays based on usage or engagement data, and prioritize accounts with the highest expansion potential?
Evidence to pull: expansion pipeline report, whitespace analysis, account scoring model, expansion conversion by segment and product, expansion revenue vs target.
Red flags: expansion logged as “opps” without stages, no whitespace mapping, expansion is reactive (only when a customer asks) rather than proactive, no distinction between upsell and cross-sell pipeline.
Step 4: Plot your Heatmap
This is a simple visual that shows exactly where the weak points are across our GTM Ops.
Create a grid with each area of GTM (Pipeline Management, Inbound, Outbound, ABM/Allbound, Partners/Channel, Renewals, Expansion) on one axis and the four maturity stages mapped to their respective questions (Fundamentals: Q1, Adoption: Q2, Optimization: Q3, Acceleration: Q4) on the other. Fill in each cell with its corresponding color-coded answer.
You can use our worksheet here.
Here’s an example:
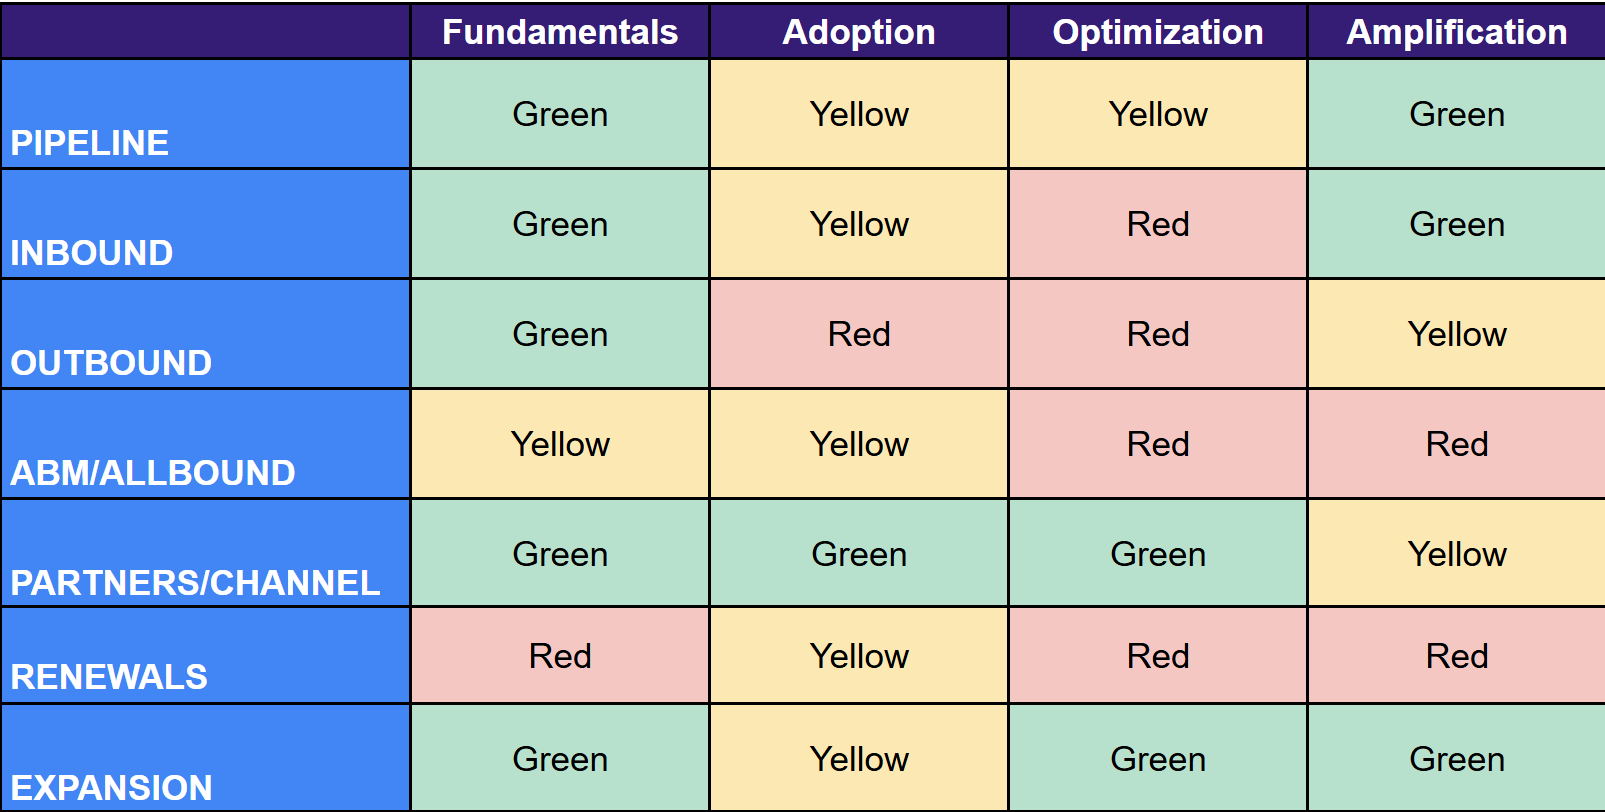
Step 5: Interpret and Prioritize
Here’s how to interpret your heatmap:
Start with the focus area(s) we identified above.
If any Fundamentals score Red or Yellow → fix that first.
If Fundamentals are Green, but Adoption is Red or Yellow → focus on execution consistency (coaching and adoption of your teams to consistently execute fundamental processes).
Only work on Optimization once the lower layers are Green.
Only work on Amplification once Optimization is Yellow or Green.
If everything is yellow, this usually means nothing has been committed to fixing completely. We’re dabbling everywhere but mastering nothing. Pick one area of GTM, get it to green through at least Adoption, then move to the next.
It’s worth noting that we often prioritize Fundamentals and Adoption across all of GTM before tackling Optimization and Amplification. Setting that foundation can be done extremely quickly and having it in place can drive 80% of the results with 20% of the effort. Further optimizing and accelerating a working motion can take much longer.
Danger Zone: Optimization or Amplification scoring Yellow or Green while Fundamentals and/or Adoption are Red or Yellow is a hazard for data reliability, scalability, and profitable revenue growth.
Trying to execute optimization or amplification strategies without consistent, accurate data means more than running blind. It means making confident decisions that could be driving the business in exactly the wrong direction.
Prioritization from here is straightforward: Your weakest maturity stages in the area(s) of GTM you need to focus most become your primary focus area for the next 90 days.
Step 6: Building Your Roadmap
A diagnostic without action is just an interesting exercise.
To put these insights into action, you’ll need a RevOps Roadmap. Explaining the full roadmap-building process is out of scope for this Framework, but luckily we have a whole other Framework on the topic. Click here to check it out.
Caution: We typically have only 3-5 initiatives on the Roadmap at one time. In this visual we wanted to provide more examples.
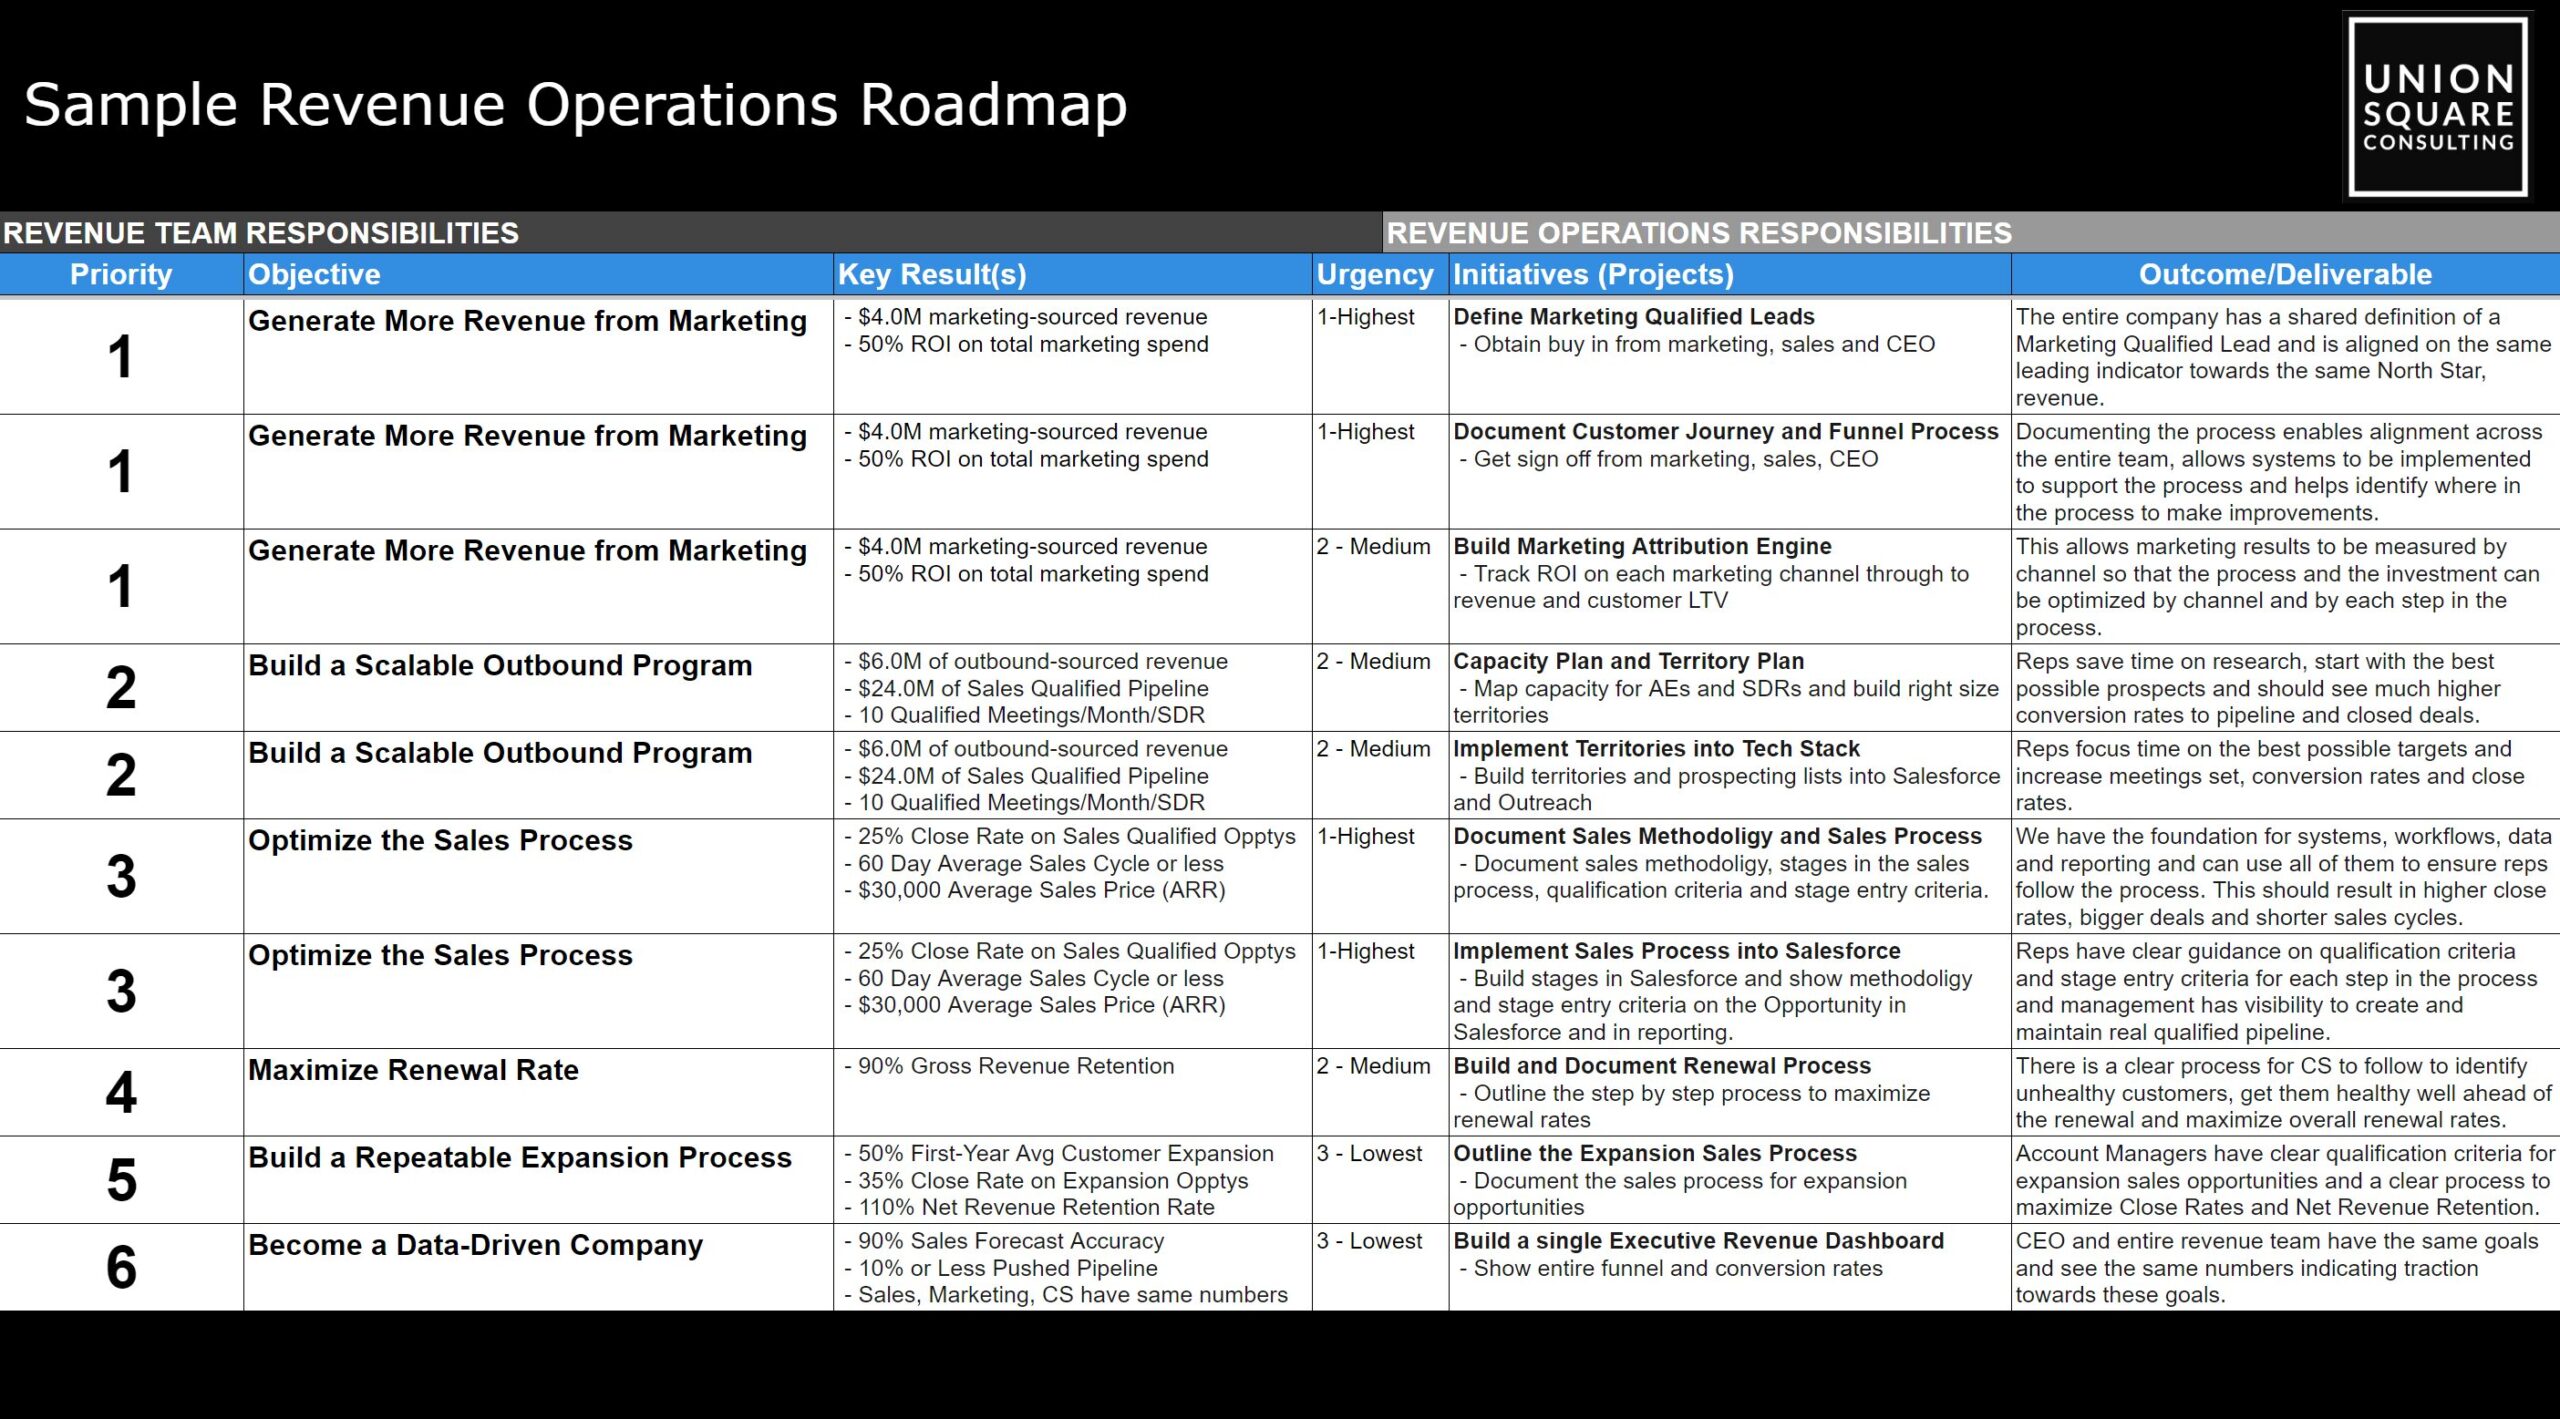
Here’s a simplified rundown:
- Based on your diagnostic insights, define 3-5 clear initiatives with specific deliverables and a single owner accountable for each. Also define 1-3 key metrics tied to each initiative and begin tracking them.
- Break the initiatives into biweekly sprints with concrete milestones: what specifically will be done in the next two weeks?
- Get explicit buy-in from the leadership team before you start. Show them the heatmap, walk through the logic, get agreement that this is the priority.
- Review progress weekly with the initiative owners, biweekly with the broader RevOps team, and monthly with leadership.
- Each quarter, re-run the diagnostic process based on where your revenue team is actively at. Use those results to rebuild the Roadmap: accounting for what’s been completed, what’s stalled, and what new initiatives are required to continue moving up the pyramid.
Resist the urge to chase every fire drill. The roadmap keeps you focused on the projects that will create lasting revenue impact, while giving you air coverage to triage ad hoc tickets appropriately (you’ll be amazed how many “emergencies” are suddenly not that urgent when you remind people what priorities the ELT has signed off on).
Step 7. Integrating Planning and Metrics
What get’s measured get’s managed.
It’s extremely important to tie key GTM metrics to the initiatives in the roadmap so that everyone on the team is working towards clearly defined shared goals.
Let’s say we need to improve pipeline management. Why? Is it because we want to feel warm and fuzzy having a nice pipeline report? Or is it to improve our Close Rate, ASP, and/or Sales Cycle? Whatever it is, we need to identify the metric and work towards achieving it.
This segues into Annual Planning. This year’s plan might have been based on some hopes and prayers. We couldn’t measure our Close Rate accurately, for example, so we had to take a guess at what’s possible this year to hit our target. Do we want next year’s planning to be the same?
If not, we need to define the metrics that matter for the initiatives on our roadmap and work consistently towards improving them this quarter and beyond.
Read more on GTM Metrics here and Annual Planning here.
To make these improvements sustainable:
- Tie each initiative to measurable metrics (conversion rates, NRR, CAC Payback, etc.).
- Build an Annual GTM Plan using both top-down and bottom-up planning.
- Create a regular cadence to review GTM Metrics and work on improving them.
- Refresh the roadmap once per quarter based on performance.
What Comes Next
This framework gives revenue leaders enough to be dangerous, but it’s just a preview.
Our full diagnostic includes deeper lines of questioning for each area of the revenue engine, key metrics to support each area of GTM, audits of revenue systems (CRM, MAP, etc), RevOps Roadmap creation, as well as re-evaluation each quarter of the diagnostic and Roadmap.
If you’re ready to go deeper, or need help executing on what’s been identified, that’s exactly what we do at Union Square Consulting.
Past the diagnosis?
Let’s get it moving.Book a free GTM Ops Execution Workshop.
Bring your top priority and walk away with a validated approach, a phase-by-phase roadmap, and an execution timeline.